|
|
|
|


Experimental Test Bed
As our experimental test bed, we set up four Pentium-based laptops as transmitters (sensors) on the 4th floor of the Photonics Building at Boston University. These transmitters are denoted by numbers 1, 2, 3, and 4 on the floor plan in Figure 1. Each transmitter was running Linux Redhat 8.0 and was equipped with a Cisco Aironet 350 wireless. These adaptors are compliant with the IEEE 802.11b wireless standard at 2.4 GHz bandwidth.
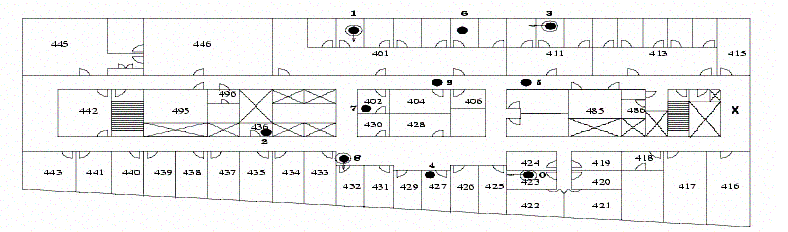
Figure 1 - Floor Plan
In our test bed, each transmitter periodically broadcast 1000-byte ID packets using User Datagram Protocol (UDP) with a transmitting power of 100 mW and a data rate of 5.5 Mbps. The packet transmission rate was set to 40 packets per second. By placing these four transmitters in the locations mentioned earlier, we obtained 10 distinct regions throughout the floor (not including areas where no transmitter signal was received).
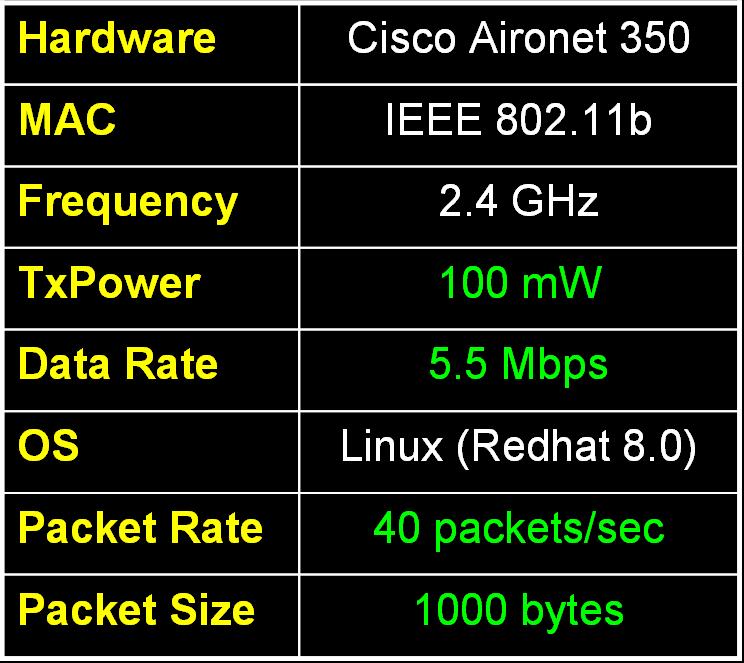
Figure 2 - Experiment Setup
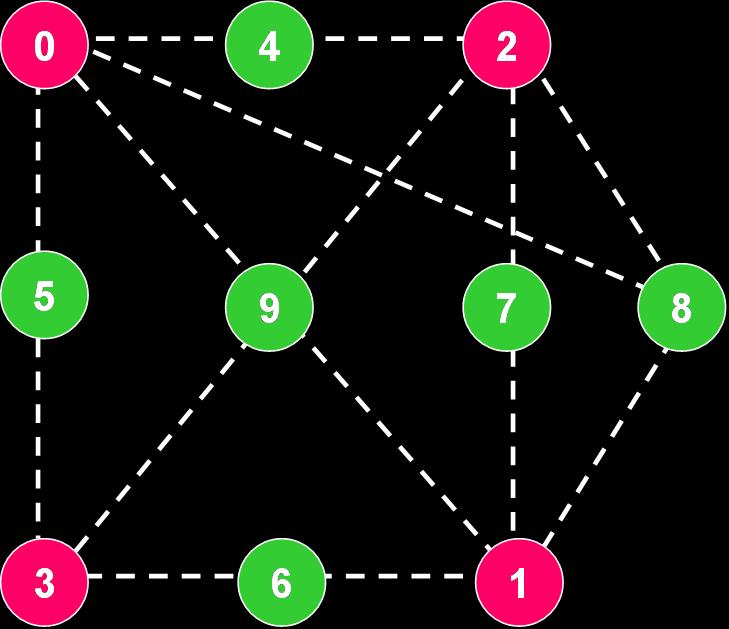
Figure 3 - Identifying Sets
Each region was discovered by placing a receiver laptop at locations on the floor where we expected to see a new region. Then we conducted more thorough experiments to determine the regions’ reliability. These experiments consisted of recording 4000 data samples at each position to determine whether a region reading was consistent. Since during the experiment we found that the Cisco Aironet 350 adaptors are directionally sensitive, these 4000 records consisted of 1000 records in the north, east, south, and west directions.
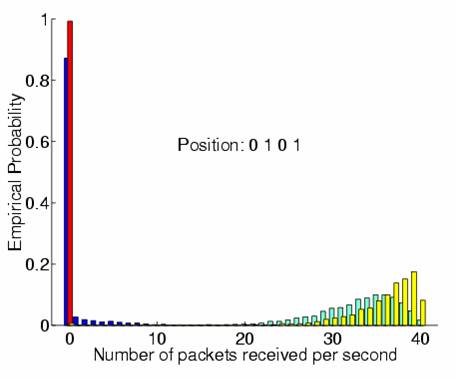
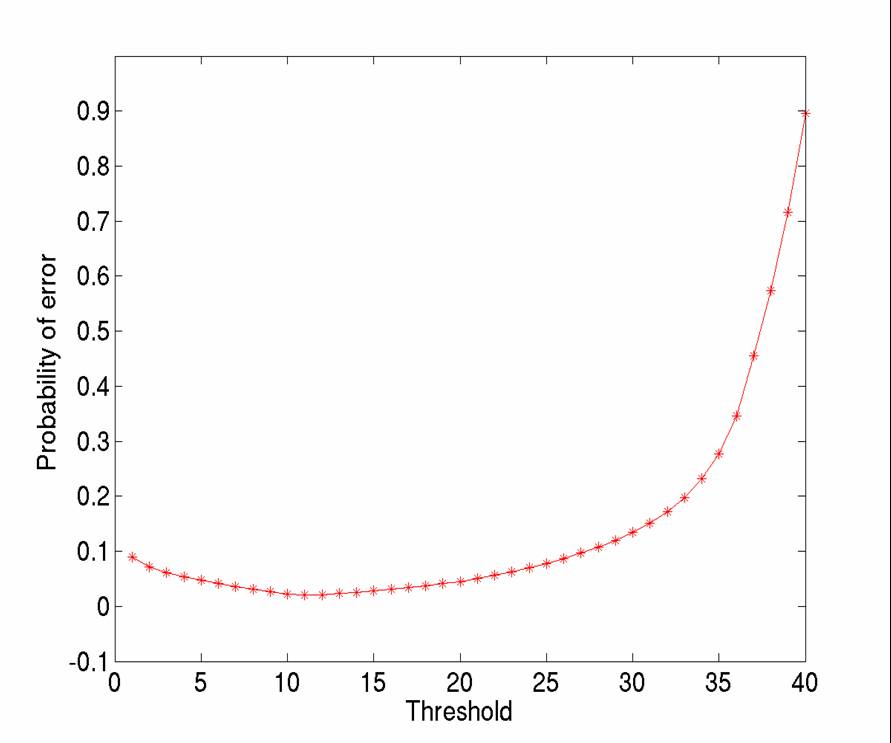
The results of one such data collection (for region 6) are shown in Figure 4. The clear separation in the number of packets received between 10 and 20 shows that this region is well defined for thresholds between 10 and 20. Deciding on the threshold to determine connectivity between a region and a transmitter is important to the reliability of a region. After all 10 region readings were made, the data was analyzed and the probability of error was shown to be minimized when the threshold is in the area of 15 packets per second. A graphical representation is shown in Figure 5, where the minimum of the curve is clearly in the area of 15 packets per second.
|
|
|
Figure 4 - Probability of Region Detection |
|
|
|
Figure 5 - Optimal Threshold Determination |
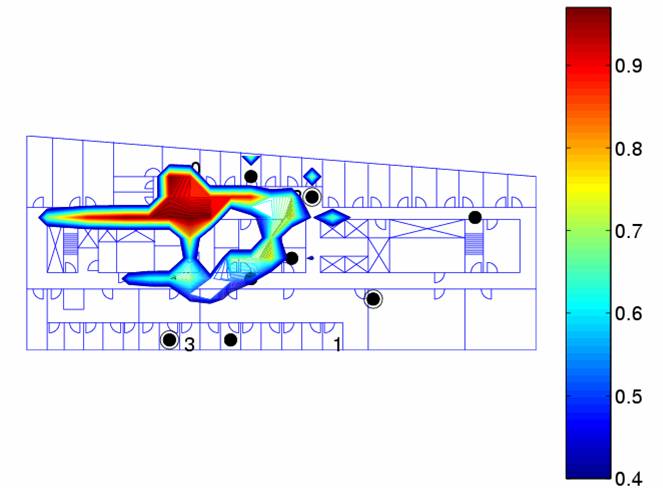
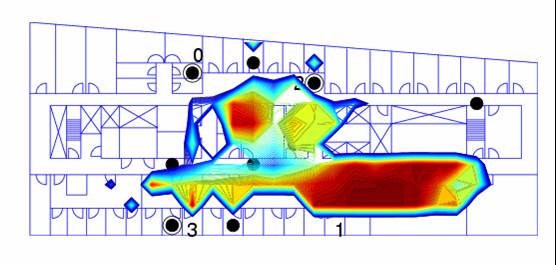
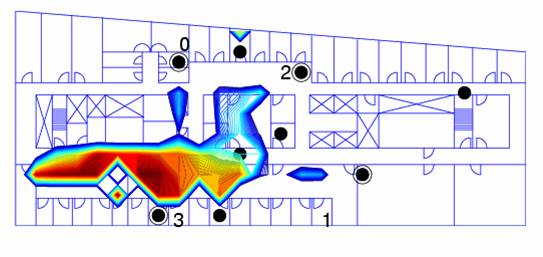
Once all 10 regions were tested thoroughly to have at least a small area of high reliability, the next steps were to determine the range of each transmitter and the size of each region. To achieve this goal, we took readings of 60 records for each direction at 120 different points throughout the floor. Using a threshold of 15 packets per second, we found the probability of meeting this threshold for each transmitter at each of the 120 points. These results are summarized in Figures 6 and 7.
|
|||||||||
|
|
|
|
|
Transmitter 2 Transmitter 3 |
|
|
|
Figure 7 -Transmitter Ranges |
|
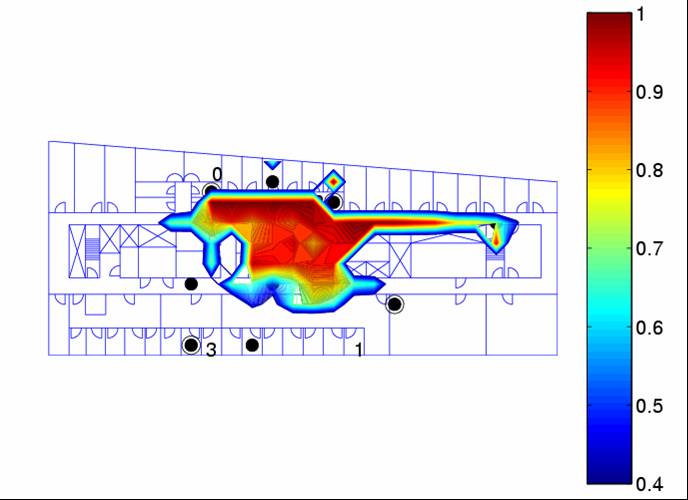
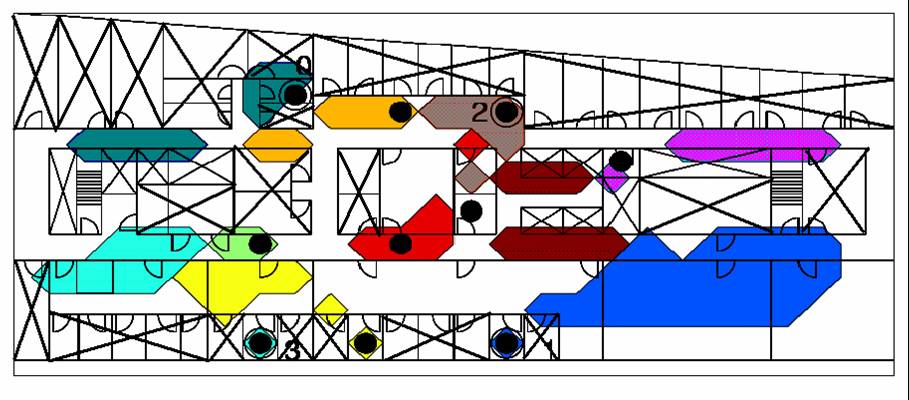
Next we determined the size of each region. Using the same 120 points of data and 15 packets per second threshold we found where each region exists with a probability of 70% or greater. The region sizes and placements are depicted in Figure 8. They are not all contiguous due to lack of room access in some areas and because the 70% certainty is not attainable in all areas. A decrease in the certainty would allow the floor to be covered more completely.
|
|
|
Figure 8 - Regions |
Lab of Networking and Information Systems
Room 413 Photonics Building
8 St Mary's Street, Boston MA 02215
Web site created by Chris Malladi (cmalladi@bu.edu)