 ...researching fundamentals of networking and communications
|
Robust Location Detection using Identifying CodesUndergraduate Student: Chris Malladi Graduate Student: Rachanee Ungrangsi Advisor: Professor Ari Trachtenberg Reference: Saikat Ray, Rachanee Ungrangsi, Francesco de Pellegrini, Ari Trachtenberg, and David Starobinski, ``Robust Location Detection in Emergency Sensor Networks,'' in INFOCOM 2003 Rachanee Ungrangsi, "Location Detection In Emergency Sensor Networks Using Robust Identifying Codes," Master's Thesis, Boston University, Boston, 2003Motivation:Coordination is vital to emergency operations during natural, accidental, and man-made disasters. A key component in such coordination is the ability to robustly detect the location of rescue personnel, victims, and building components. With such information, future command control centers could visualize a disaster site and direct rescues around hazardous areas and towards exits, as needed. Unfortunately, existing positioning systems are not able to provide the robust location detection needed in these emergency situations. Beacon systems are not robust because they rely on a single transmitter for an area. GPS is not a reliable system for indoor location detection.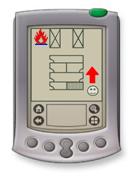 It does not matter that you are 5 or 10 feet away from the fire, but it is more important that you are in the same room where the fire is. It does not matter that you are 5 or 10 feet away from the fire, but it is more important that you are in the same room where the fire is.
System OverviewIn the proposed scheme, sensors are strategically positioned in building infrastructure and directed to broadcast identifying packets. With appropriate tools, any person can then determine his location based on the received packets. This approach generalizes existing proximity based location detection techniques by allowing sensor coverage areas to overlap in resolvable regions.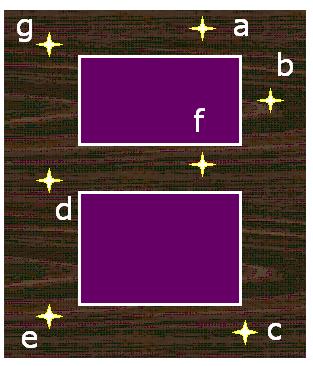 Step 1: Select Discrete Locations 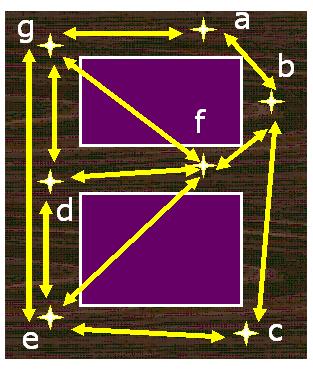 Step 2: Construct Connectivity Graphs 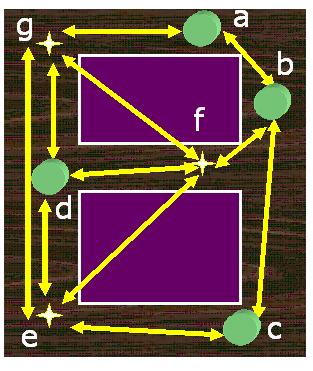 Step 3: Determine Sensor Placements 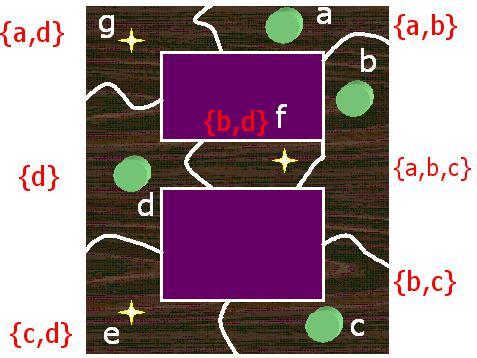 Step 2: Final: Each region uniquely identify by sensors ID Test bed DevelopmentAs our experimental test bed, we set up four Pentium-based laptops as transmitters (sensors) on the 4th floor of the Photonics Building at Boston University. These transmitters are denoted by numbers 1, 2, 3, and 4 on the floor plan in Figure 1. Each transmitter was running Linux Redhat 8.0 and was equipped with a Cisco Aironet 350 wireless. These adaptors are compliant with the IEEE 802.11b wireless standard at 2.4 GHz bandwidth. Figure 1 - Floor Plan In our test bed, each transmitter periodically broadcast 1000-byte ID packets using User Datagram Protocol (UDP) with a transmitting power of 100 mW and a data rate of 5.5 Mbps. The packet transmission rate was set to 40 packets per second. By placing these four transmitters in the locations mentioned earlier, we obtained 10 distinct regions throughout the floor (not including areas where no transmitter signal was received).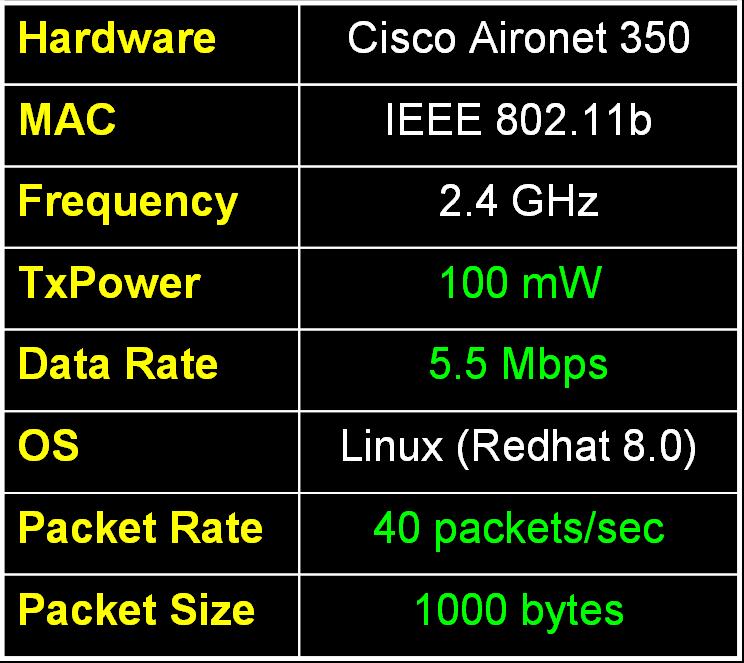 Figure 2 - Experiment Setup 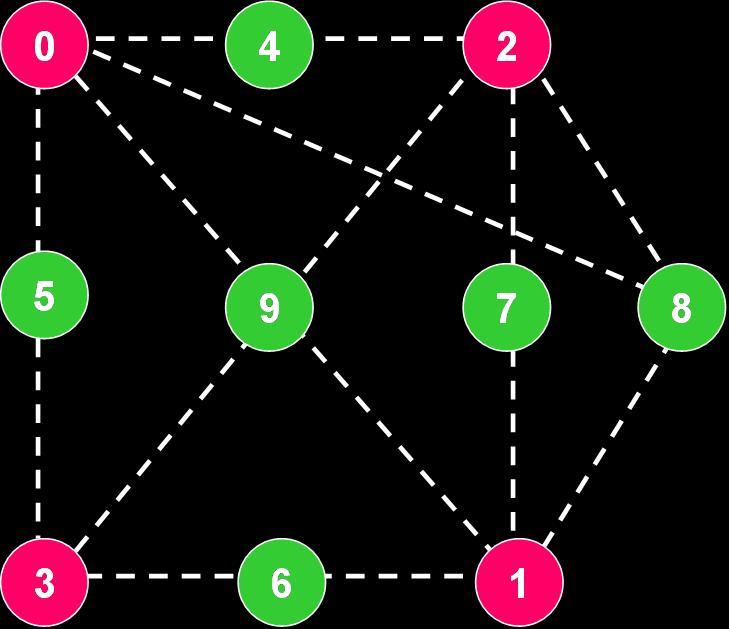 Figure 3 - Identifying Sets Each region was discovered by placing a receiver laptop at locations on the floor where we expected to see a new region. Then we conducted more thorough experiments to determine the regions reliability. These experiments consisted of recording 4000 data samples at each position to determine whether a region reading was consistent. Since during the experiment we found that the Cisco Aironet 350 adaptors are directionally sensitive, these 4000 records consisted of 1000 records in the north, east, south, and west directions. The results of one such data collection (for region 6) are shown in Figure 4. The clear separation in the number of packets received between 10 and 20 shows that this region is well defined for thresholds between 10 and 20. Deciding on the threshold to determine connectivity between a region and a transmitter is important to the reliability of a region. After all 10 region readings were made, the data was analyzed and the probability of error was shown to be minimized when the threshold is in the area of 15 packets per second. A graphical representation is shown in Figure 5, where the minimum of the curve is clearly in the area of 15 packets per second.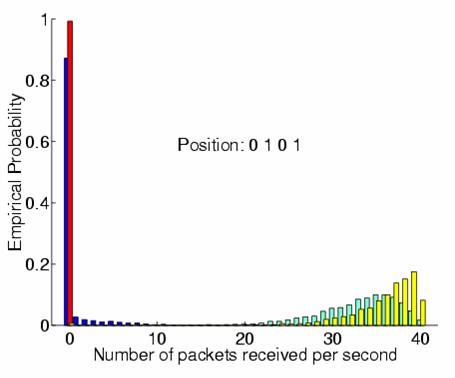 Figure 4 - Probability of Region Detection 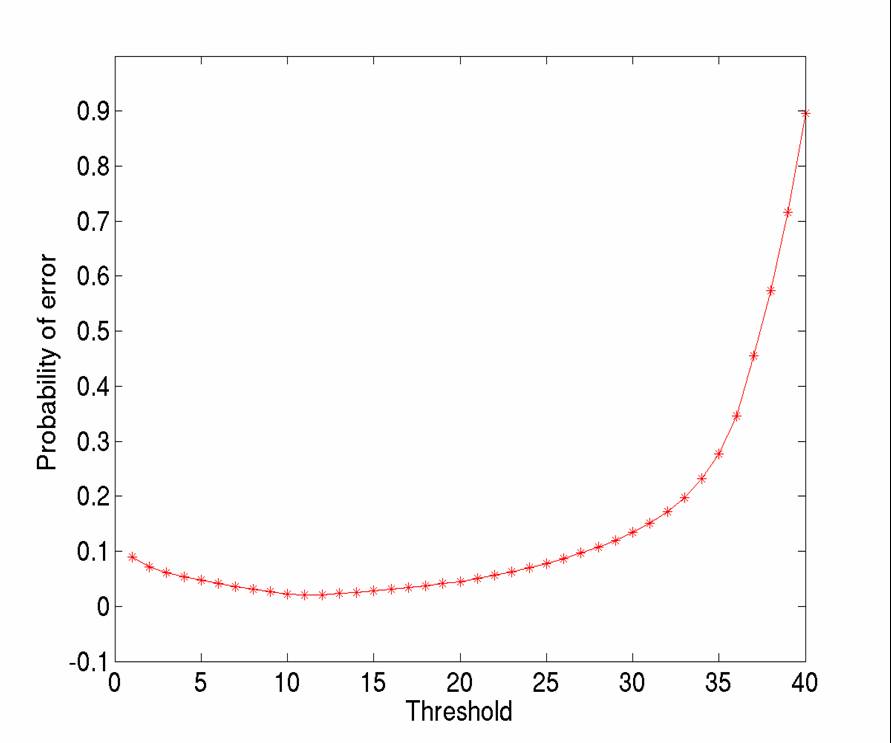 Figure 5 - Optimal Threshold Determination Once all 10 regions were tested thoroughly to have at least a small area of high reliability, the next steps were to determine the range of each transmitter and the size of each region. To achieve this goal, we took readings of 60 records for each direction at 120 different points throughout the floor. Using a threshold of 15 packets per second, we found the probability of meeting this threshold for each transmitter at each of the 120 points. These results are summarized in Figures 6 and 7.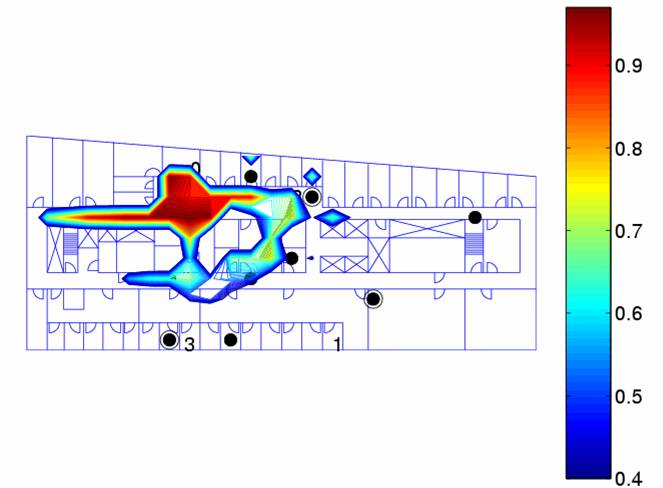
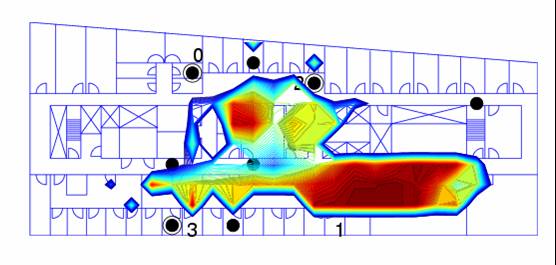 Figure 6 -Transmitter Ranges 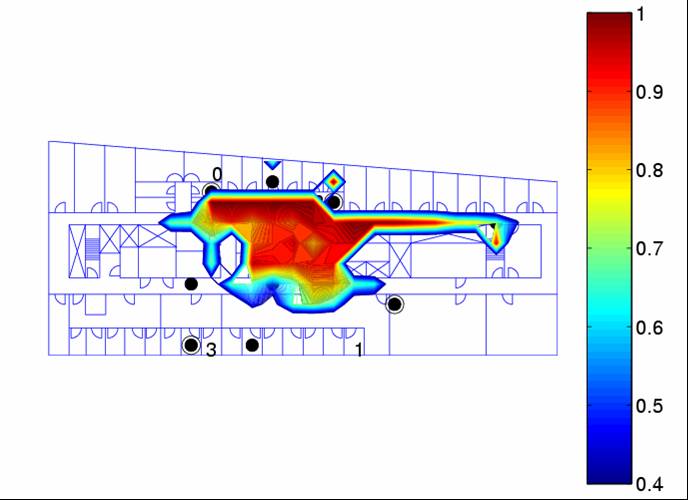
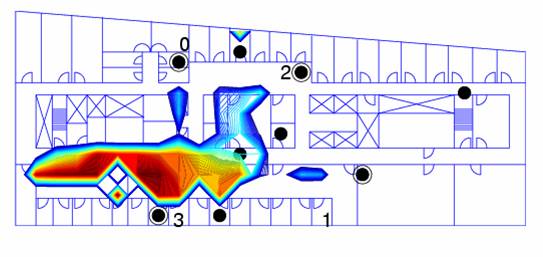 Figure 7 -Transmitter Ranges Next we determined the size of each region. Using the same 120 points of data and 15 packets per second threshold we found where each region exists with a probability of 70% or greater. The region sizes and placements are depicted in Figure 8. They are not all contiguous due to lack of room access in some areas and because the 70% certainty is not attainable in all areas. A decrease in the certainty would allow the floor to be covered more completely.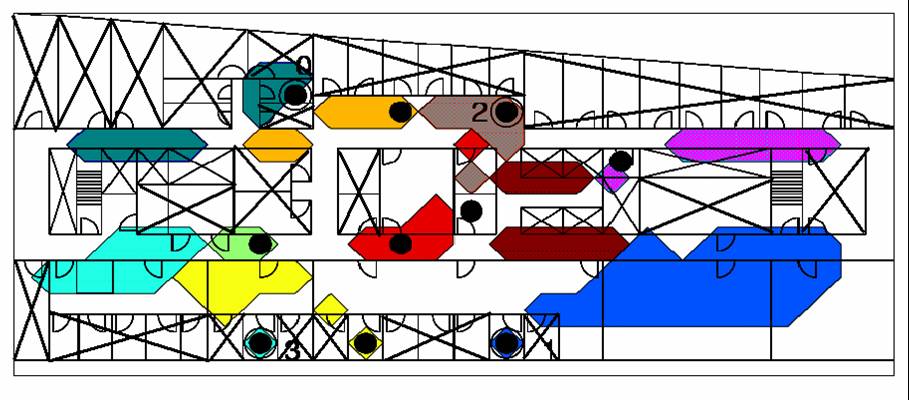 Figure 8 - Regions Java Applet DemonstrationApplet Description:The applet can be found here. This applet shows a demonstration of our location detection inside the test bed that we have developed. In this demo, we configured our system to track a mobile user as he walked around on the 4th floor of the Photonic Building, Boston University. The black arrow > represents the current position of the user. The blue trail >>> left behind is just for reference. Black boxes ■ represents 10 reference points on the test bed whereas green dots ● are the location of 4 transmitters. As the black arrow moves on the demo path, the applet calculates which region the arrow is in, and shows the appropriate box colored box to indicate that region. In this demo, we determine the region based on the number of packets received from each transmitter with the threshold of 15 packets. We update the user's location every 4 samples. If the decoding certainty is greater than 75%, the current location is shown as blue box ■. Otherwise, the box is red ■. The demo shows that our system always chooses the region which is close to the black arrow. However, it will not always show the box which appears to be the closest if the user is at the edge of a region. The original applet runs on the Applet Viewer. Suggested HTML configuration for the demo applet is:<applet code = "combine.class" codebase="PathToTheDirectoryOfClassFile" width=700 height=500> </applet>Source Code for Java Applet Available Here Demo2path.dat Available Here Note: The applet shown above has been modified to view on the Java-enabled browsers. |
|
Photonics Building, Room 413
8 St Mary's Street,
Boston MA 02215
Initial web site created by Sachin Agarwal (ska@alum.bu.edu), Modified by Weiyao Xiao (weiyao@alum.bu.edu), Moved to TWiki backend by Ari Trachtenberg (trachten@bu.edu). Managed by Jiaxi Jin (jin@bu.edu).